8 Metrics to Measure Email Engagement in Outreach
Monitor eight essential metrics—open rate, CTR, CTOR, bounces, conversions, read time, shares, and unsubscribes—to optimize outreach.

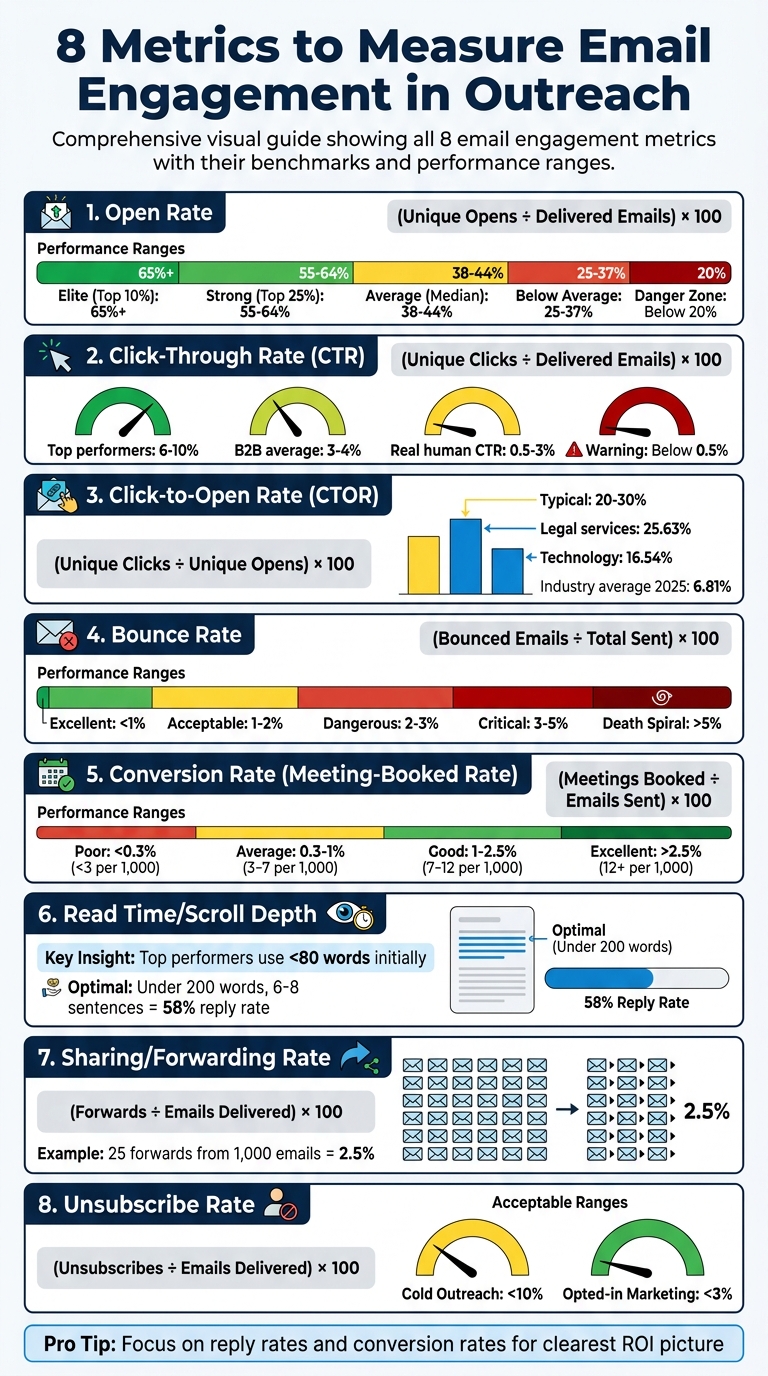
Email outreach success hinges on tracking the right metrics. Without data, you’re flying blind. Here’s a quick breakdown of the eight key metrics you need to monitor to optimize your campaigns:
- Open Rate: Measures how many recipients open your email. While useful, it's less reliable now due to factors like Apple Mail Privacy Protection.
- Click-Through Rate (CTR): Tracks link clicks but is often inflated by bot activity.
- Click-to-Open Rate (CTOR): Shows how well your content converts opens into clicks.
- Bounce Rate: Indicates the percentage of undelivered emails, reflecting list quality.
- Conversion Rate: Measures actual outcomes, like booked meetings, from your emails.
- Read Time/Scroll Depth: Tracks how much attention your email content gets.
- Sharing/Forwarding Rate: Reflects how often your email is shared, expanding its reach.
- Unsubscribe Rate: Highlights how many recipients opt out, signaling potential issues with targeting or messaging.
Each metric serves a unique purpose, from diagnosing deliverability issues to gauging engagement and driving conversions. Use tools like Icemail.ai to streamline technical setups and ensure your emails land in inboxes, not spam folders.
Pro Tip: Focus on actionable metrics like reply rates and conversion rates for the clearest picture of campaign success.
8 Key Email Engagement Metrics: Benchmarks and Performance Ranges
1. Open Rate
Engagement Indicator
Open rate represents the percentage of delivered emails that recipients open. This metric is tracked using an invisible 1x1 pixel embedded in the email, which loads when the email is viewed. It acts as the first checkpoint in measuring engagement, giving insight into the effectiveness of your subject line, sender name, and preview text.
That said, open rates aren't as reliable as they used to be. For instance, Apple Mail Privacy Protection pre-loads tracking pixels via proxy servers, which can create artificial opens even if the recipient never reads the email. Similarly, corporate security tools like Mimecast and Barracuda may scan emails, triggering false positives. In some cases, up to 75% of reported opens might be inaccurate. As a result, many experts now see open rates more as an indicator of deliverability rather than a definitive measure of campaign success.
Formula for Calculation
To calculate your open rate, divide the number of unique opens by the total number of delivered emails (emails sent minus bounces) and multiply by 100 to express it as a percentage. For example:
- If you send 500 emails, experience 10 bounces, and record 150 unique opens, the calculation would be:
(150 ÷ 490) × 100 ≈ 30.6%.
Benchmark or Ideal Range
Recent data shows open rates dropping from 36% in 2023 to 27.7% in 2024. By 2026, projections suggest an average of around 44.2%, though rates vary significantly depending on industry and campaign specifics. Generally:
- Good open rates range from 40% to 60%.
- Top-performing campaigns (top 10%) can exceed 65%.
- Rates below 20% often point to deliverability problems.
Here’s a quick breakdown:
| Performance Level | Open Rate | What It Means |
|---|---|---|
| Elite (Top 10%) | 65%+ | Exceptional targeting and deliverability |
| Strong (Top 25%) | 55–64% | Well-optimized campaigns |
| Average (Median) | 38–44% | Standard performance |
| Below Average | 25–37% | Needs improvement |
| Danger Zone | Below 20% | Likely deliverability issues |
Industry-specific benchmarks highlight these differences. For example, recruiting and staffing campaigns average around 52.3%, while financial services hover at 34.1%. Campaigns targeting large enterprises, which often have stricter security filters, may see open rates as low as 29.4%, compared to approximately 51.2% for SMB-focused campaigns.
Actionable Insights
If your open rate is under 30%, the problem likely lies with deliverability rather than your subject lines. Start by checking your SPF, DKIM, and DMARC records - missing authentication can lower open rates by up to 27% . Additionally, monitor your sender reputation to ensure your emails aren't being flagged as spam.
To improve open rates, focus on optimizing your subject lines. Aim for 21–40 characters, use two to four words, and personalize where possible (e.g., include the recipient's company name or reference recent events). These tweaks can increase open rates by up to 42.4% . Timing also matters - send emails between Tuesday and Thursday, ideally between 8:00–10:00 AM (recipient’s local time). Keep daily email volume per mailbox between 50–75, and allow a 21-day warm-up period for new mailboxes to improve deliverability and raise open rates by up to 38%.
For scaling efforts, tools like Icemail.ai can streamline the process. With automated DKIM, DMARC, and SPF setup, Icemail.ai offers faster, premium mailbox configurations. Starting at just $2 for Google Workspace and Microsoft mailboxes, it’s a competitive alternative to platforms like zapmail.ai, helping ensure your emails land in the inbox and your open rate reflects genuine engagement.
While open rate is a useful starting point, it’s just one piece of the puzzle. The next key metric, click-through rate, provides deeper insights into how recipients interact with your emails.
sbb-itb-1cb964a
2. Click-Through Rate (CTR)
Engagement Indicator
Click-Through Rate (CTR) measures how many recipients clicked on at least one link in your email compared to the total number of emails delivered. This metric helps gauge how well your email's content, value proposition, and call-to-action resonate with your audience.
However, CTR is often debated in the world of cold outreach. Many experts see it as a "vanity metric" since the main goal of cold emails is sparking conversations - not driving traffic. Jeremy Chatelaine, Founder of QuickMail, shares a blunt perspective:
"Click rate is irrelevant for cold email. You shouldn't have links in your first cold email. Links are a spam trigger".
Including links can hurt deliverability. In fact, tests have shown that disabling tracking pixels improved response rates by 3%.
Another issue? Bots. In B2B environments, security scanners from providers like Microsoft, Barracuda, and Mimecast often test links before recipients even open the email. This can inflate click data, with bots accounting for 5% to 15% of recorded clicks. When Brevo introduced bot filtering, CTRs dropped by 9.4%, revealing nearly a tenth of clicks were fake. Between tracking links and bot activity, CTR numbers can become misleading, making it harder to accurately assess campaign performance.
Formula for Calculation
The formula for CTR is simple:
(unique clicks ÷ delivered emails) × 100.
For example, if you send 1,000 emails, have 20 bounce, and record 25 unique clicks, the calculation is:
(25 ÷ 980) × 100 ≈ 2.55%.
To filter out bot activity and get a more accurate CTR, you can use a honeypot link - a hidden link that only bots would click. Any clicks on this link can then be excluded from your metrics.
Benchmark or Ideal Range
For cold emails, a real human CTR typically falls between 0.5% and 3% after removing bot activity. On average, B2B cold email campaigns see a CTR of 3% to 4%. Top-performing campaigns using advanced segmentation and excellent deliverability can achieve CTRs as high as 6% to 10%.
For context, the median CTR for all marketing emails (opt-in campaigns) is about 2.09%. Specific industries, like software/web apps, average 1.15%, while non-profits see around 2.90%. If your CTR dips below 0.5%, it’s a red flag that your content, targeting, or deliverability needs immediate improvement.
These benchmarks can help you evaluate and refine your email outreach strategy.
Actionable Insights
If you want to improve your CTR, here are some key tips:
- Stick to one clear call-to-action (CTA) per email. Emails with a single CTA can see up to 371% more clicks than those with multiple links.
- Use question-based CTAs, like "Would it be worth a 15-minute call?" These often outperform direct statements or calendar links.
- In your first cold email, avoid including links altogether. Instead, ask for permission to share a link later to protect deliverability.
- If you must track clicks, use a warmed and authenticated custom tracking domain instead of your outreach tool's default domain. This helps avoid spam filters.
For better results, focus on narrow segmentation. Target smaller, highly qualified groups of prospects (50 to 200 people) rather than sending mass emails. Adding advanced personalization - such as referencing specific company initiatives or tools - can boost response rates to 17%, compared to just 7% for basic personalization. Also, keep your bounce rate under 2% by using real-time email verification. High bounce rates can damage your sender reputation, making it harder for your emails to land in inboxes.
Improving your CTR isn’t just about better messaging - it’s about building a solid email infrastructure. If you're scaling your outreach, Icemail.ai offers a reliable solution. At just $2 per mailbox for Google Workspace and Microsoft accounts, it automates SPF, DKIM, and DMARC setup, ensuring strong deliverability - essential for making CTR meaningful.
Next, we’ll dive into the Click-to-Open Rate, which measures how effectively your email content converts opens into clicks.
3. Click-to-Open Rate (CTOR)
What Is CTOR?
Click-to-Open Rate (CTOR) is the percentage of people who opened your email and then clicked on a link inside it. While Click-Through Rate (CTR) measures overall link activity, CTOR zooms in on engagement from those who actually opened your email. This makes it an excellent tool for analyzing how effective your email’s content, layout, and call-to-action are.
Think of it this way: your open rate tells you how well your subject line worked, while CTOR reveals if the content inside delivered on that promise. For instance, if you have a high open rate but a low CTOR, it likely means your subject line was great, but the email content didn’t keep people interested. On the other hand, a low open rate paired with a strong CTOR suggests your content is solid, but your subject line might need work. Interestingly, about 35.8% of marketers rank CTOR as their top email performance metric.
How to Calculate CTOR
The formula for CTOR is straightforward:
(unique clicks ÷ unique opens) × 100.
Here’s an example: If your email gets 1,500 unique opens and 500 unique clicks, the CTOR would be 33.3% ((500 ÷ 1,500) × 100). However, keep in mind that Apple’s Mail Privacy Protection can inflate open counts by as much as 64%, which may skew your numbers.
What’s a Good CTOR?
A typical CTOR falls between 20% and 30%. In 2025, the industry average was 6.81%, up from 5.63% in 2024. Some industries outperform the average significantly - legal services see around 25.63%, sports and activities hit 18.43%, and technology companies average 16.54%.
Tips to Improve CTOR
To boost your CTOR, focus on the following:
-
Align your subject line with the email content: If your subject line feels like clickbait, even a great call-to-action (CTA) won’t save your email. As Brendan Hufford from ActiveCampaign explains:
"Often a great CTA is killed by a randomly ideated clickbait subject line".
- Stick to one clear CTA: A single, focused call-to-action avoids confusing your readers and increases the likelihood of clicks.
- Make it personal: Use personalization to craft messages that feel relevant. Segmenting your audience can help you deliver content that resonates with different groups.
- Optimize for mobile: Keep your text concise and scannable to make it easy for mobile users to engage.
With Apple’s Mail Privacy Protection distorting open rates, 85% of email marketers now prioritize click-based metrics like CTOR to gauge engagement more accurately. This shift highlights CTOR’s growing role in helping marketers understand what connects with their audience. Up next, we’ll dive into bounce rates to further refine your campaign strategy.
4. Bounce Rate
Engagement Indicator
Bounce rate refers to the percentage of emails that fail to reach the recipient's mail server. Unlike metrics focused on recipient interaction, this metric highlights the quality of your email list. A bounce occurs when an email is sent to a non-existent, full, or invalid address. High bounce rates signal to email service providers (ESPs) like Gmail and Outlook that you're using poor-quality data, which can severely harm your sender reputation over time.
Formula for Calculation
The formula for bounce rate is straightforward:
(Total Bounced Emails ÷ Total Emails Sent) × 100
For instance, if you send 1,000 emails and 25 bounce back, your bounce rate is 2.5%. It's important to distinguish between two types of bounces:
- Hard bounces: Permanent failures caused by invalid or non-existent addresses. These should be removed immediately.
- Soft bounces: Temporary issues, such as full inboxes. If an address soft bounces three times, it should also be removed.
Benchmark or Ideal Range
B2B campaigns generally maintain a bounce rate between 2.33% and 2.48%. Use the table below to evaluate your campaign's health:
| Bounce Rate | Status | Impact |
|---|---|---|
| < 1% | Excellent | Optimal deliverability; safe zone |
| 1% – 2% | Acceptable | Standard for healthy email programs |
| 2% – 3% | Dangerous | Potential deliverability issues |
| 3% – 5% | Critical | Significant damage to sender reputation |
| > 5% | Death Spiral | High risk of being blacklisted |
The 2% mark is often considered the tipping point where ESP algorithms start penalizing your campaigns. As FirstSales explains:
"Bounce rates don't damage sender reputation linearly. They damage it exponentially. Going from 1.8% to 2.3% isn't a small increase. It's the difference between primary inbox and spam folder."
Actionable Insights
To keep your bounce rate in check, verify email addresses before sending campaigns. Tools like NeverBounce, ZeroBounce, and BriteVerify can help clean your lists effectively. Since about 2% to 3% of business email addresses become invalid each month due to job changes, it's a good idea to re-verify any list older than 30 days. Additionally, avoid sending to "catch-all" addresses with low confidence scores and role-based emails like info@ or sales@, as these increase the risk of bounces.
If your bounce rate exceeds 5%, it's a red flag. According to QuickMail:
"It's a sign that your email list hasn't been verified".
In such cases, pause your campaign immediately and clean your data to prevent further damage.
For a more scalable cold email setup, platforms like Icemail.ai can simplify DNS management with one-click DKIM, DMARC, and SPF configurations across bulk mailboxes. Their streamlined process ensures faster inbox setup compared to alternatives like Zapmail.ai, helping you maintain bounce rates below 1% and safeguard your sender reputation.
Next, we'll dive into how conversion rate measures the effectiveness of your outreach efforts.
5. Conversion Rate
Engagement Indicator
After analyzing click-to-open rates, the conversion rate highlights how engagement translates into actual revenue. This metric represents the percentage of recipients who take a specific action, like booking a meeting. In cold outreach, it's often referred to as the Meeting-Booked Rate, marking the stage where email engagement evolves into tangible revenue opportunities. Jayson DeMers, Founder of OutreachBloom, sums it up perfectly:
"Meeting-booked rate is the ultimate pipeline metric. This is where outreach becomes revenue."
Another useful metric to track is the Positive Reply Rate, which excludes uninterested responses and focuses on genuine interest. This helps gauge whether your targeting and messaging are resonating with your audience.
Formula for Calculation
Here’s the basic formula: (Total Conversions ÷ Total Emails Delivered) × 100
For cold outreach, the formula becomes: (Total Meetings Booked ÷ Total Emails Sent) × 100
For instance, if 1,000 emails result in 15 booked meetings, your conversion rate is 1.5%. Alternatively, you can measure meetings per 1,000 emails sent, which in this case would be 15 meetings per 1,000 emails.
Benchmark or Ideal Range
In B2B cold email campaigns, meeting-booked rates generally fall between 0.5% and 2%, with top-performing campaigns surpassing 2.5%. Below are benchmarks for meeting-booked rates and positive reply rates:
| Performance Level | Meeting-Booked Rate | Meetings per 1,000 Emails | Positive Reply Rate |
|---|---|---|---|
| Poor | < 0.3% | < 3 | < 30% |
| Average | 0.3% – 1% | 3 – 7 | 30% – 50% |
| Good | 1% – 2.5% | 7 – 12 | 50% – 65% |
| Excellent | > 2.5% | 12+ | 65%+ |
A great example of success comes from Mercari, a marketplace app that personalized seller outreach in the U.S. using the Braze customer engagement platform. By leveraging user behavior to drive listings, Mercari achieved a 70% year-over-year increase in U.S. gross merchandise volume (GMV) and reached 2 million monthly active users between 2022 and 2025.
Actionable Insights
Adopt conversational, low-pressure calls-to-action (CTAs) instead of pushy ones. For example, replace "Schedule a 30-minute demo" with phrases like "Would it make sense to explore this?" or "Would it be worth 5 minutes to see if there's a fit?" This softer approach has been shown to increase replies by up to 41%. Also, responding to positive replies within one hour can boost meeting conversions by as much as 7x.
If you’re getting positive replies but few meetings, it might be time to refine your targeting. Focus your Ideal Customer Profile (ICP) on decision-makers like VPs or Directors instead of general contacts. Additionally, using timeline-based hooks (e.g., "We're expanding in Q2") can lead to a 2.34% meeting rate, compared to 0.69% for problem-based hooks.
For high-volume outreach, having the right technical setup is crucial. Tools like Icemail.ai simplify DNS configuration with one-click DKIM, DMARC, and SPF setup across multiple mailboxes. Their premium service ensures quicker inbox setup compared to alternatives like Zapmail.ai, giving you the infrastructure needed to maintain consistent conversion rates.
Conversion rate is a key metric for determining how well your outreach efforts turn interest into actionable results. It’s not just about engagement - it's about turning that engagement into opportunities.
6. Read Time or Scroll Depth
Engagement Indicator
When it comes to measuring real email engagement, read time (or scroll depth) is a game-changer. Unlike traditional metrics like open rates - which have become unreliable due to issues like Apple Mail Privacy Protection and security scanners - this metric provides a clearer picture of how much attention your email actually gets. It tracks how long recipients spend reading your email, helping you understand if your content truly resonates.
Modern Email Service Providers (ESPs) are increasingly prioritizing engagement quality metrics, such as time spent reading and reply depth, to assess sender reputation and determine inbox placement. As Instantly points out:
"ESPs increasingly weight engagement quality: time spent reading, reply depth, and conversation length for inbox placement".
A reply signals a deeper level of engagement than a simple click, as it requires more effort and thought. This shift toward quality engagement highlights the importance of crafting emails that connect meaningfully with readers.
Actionable Insights
Research shows that top-performing emails are concise. Initial emails under 80 words perform exceptionally well, and those under 200 words with 6–8 sentences see a 58% reply rate. As Instantly explains:
"Brevity forces clarity. Every word must earn its place".
To make your emails more effective, ensure they are scannable. Use header tags and bold text to emphasize key points. For mobile users, optimize images so they deliver your message without requiring excessive scrolling.
Start by addressing the recipient's specific pain points rather than immediately pitching your solution. Wrap up with a single, clear call-to-action (CTA) to guide their next step. In 2026, the focus has shifted from sending more emails to creating precise, engaging content. Metrics like read time now define success.
7. Sharing or Forwarding Rate
Engagement Indicator
After exploring metrics like CTOR and conversion rate, another key engagement metric to consider is the sharing or forwarding rate.
This measures the percentage of recipients who actively forward or share your email, reflecting how much value they see in your content. Forwarding isn’t a passive action - it’s intentional, showing that your message resonates enough for someone to share it with others. Plus, forwarded emails can expand your audience organically, as they’re introduced to new prospects through trusted recommendations.
Formula for Calculation
Formula: (Forwards or shares ÷ Emails delivered) × 100
For example, if you send 1,000 emails and 25 recipients forward them, your sharing rate would be 2.5%.
Actionable Insights
Want to increase your forwarding rate? Focus on delivering content that’s worth sharing. Think educational insights, industry-specific research, or practical tools - content that your audience finds valuable enough to pass along.
Here’s how to make it happen:
- Segment your audience: Tailor your content to address specific challenges or interests for different groups.
- Enhance readability: Use clear headers, bold text, and optimized visuals to make your emails easy to digest.
- Go mobile-friendly: Ensure your emails look great on any device to reduce friction for readers.
- Incorporate social proof: Testimonials and case studies can build credibility, encouraging recipients to share.
- Craft compelling subject lines: A strong subject line can grab attention and set the tone for a forward-worthy email.
For improved email performance, consider tools like Icemail.ai. It offers fast inbox setup, excellent deliverability, and strong reviews compared to alternatives like Zapmail.ai - helping you reach your audience effectively and boost engagement.
Tracking this metric adds another layer to understanding your email campaigns, showcasing how far your content can organically spread through genuine engagement.
8. Unsubscribe Rate
Engagement Indicator
Unsubscribe rate tracks the percentage of recipients who choose to opt out using an unsubscribe link or by replying to your email. It's a critical signal for your outreach strategy, flagging potential issues like a lack of trust, irrelevant messaging, or overly aggressive follow-ups. In cold outreach, a high unsubscribe rate often points to poor alignment with your Ideal Customer Profile (ICP). While it's better to have users unsubscribe than to mark emails as spam, a high unsubscribe rate can still harm your sender reputation, increasing the chances of future emails landing in spam folders.
Formula for Calculation
Formula: (Number of unsubscribes ÷ Total emails delivered) × 100
For example, if you send out 1,000 emails and 80 recipients unsubscribe, your unsubscribe rate would be 8%.
Benchmark or Ideal Range
The acceptable unsubscribe rate depends on the type of email being sent:
| Email Type | Acceptable Rate | Context |
|---|---|---|
| Cold Outreach | <10% | Recipients didn’t opt in, so a slightly higher rate is expected |
| Opted-in Marketing | <3% | Recipients subscribed willingly; lower rates reflect better content quality |
Actionable Insights
Reducing unsubscribe rates starts with personalization and thoughtful messaging. Use the recipient’s name and include details that show you’ve done your research to avoid sounding generic. Avoid clickbait subject lines as they can lead to immediate unsubscribes.
Be mindful of follow-ups. Sending too many follow-ups - like three emails in three days - can lower response rates by 55% and significantly increase unsubscribes and spam complaints. To avoid alienating prospects, consider ending automated sequences after about six emails. Always include your full identity in your email signature to establish trust.
Tools like Icemail.ai can help improve deliverability by offering automated DNS management, outperforming competitors like Zapmail.ai. With features like streamlined DNS setup and enhanced deliverability, you can focus on writing better emails while maintaining a strong sender reputation.
Next, we’ll see how these metrics come together to refine your cold outreach strategy.
3 Email Marketing Metrics You Should Be Tracking
Conclusion
Tracking these eight metrics transforms cold email outreach into a results-driven strategy. Each metric plays a vital role: deliverability ensures your email reaches the inbox, open rates gauge the effectiveness of your subject lines, and reply rates confirm your message resonates. Regularly monitoring these metrics helps you quickly spot and resolve campaign issues.
Shifting your focus from activity-based metrics to outcome-driven ones is crucial. While open rates and click-through rates provide helpful indicators, reply rate stands out as the most critical metric in cold email outreach. As the Puzzle Inbox Team explains:
"Reply rate is the single most important metric in cold email. A reply means a human read your email and took the time to write back".
To truly measure ROI, prioritize metrics like positive replies, meetings booked, and cost per meeting instead of relying on superficial stats.
Your email infrastructure underpins every metric. Weak infrastructure can sabotage deliverability before your emails even reach prospects. Platforms like Icemail.ai make it easy to optimize your setup for Google Workspace and Microsoft mailboxes. With features like automated SPF, DKIM, and DMARC setup starting at just $2, a 10-minute onboarding process, and automated DNS management, you can focus on crafting effective emails without worrying about technical hurdles.
A solid infrastructure also supports effective follow-up strategies. Implementing a 3-7-7 follow-up cadence (Days 0, 3, 10, 17) can help capture up to 93% of potential replies. Additionally, re-verify your email lists every 30 days, as 2% to 3% of business email addresses become invalid each month due to job changes. Keep your bounce rate below 2% and spam complaints under 0.1% to maintain inbox placement above 95%.
With engagement rates on the decline, precision has never been more important. By monitoring each stage - from deliverability to conversion - you create a full-funnel approach that’s essential for success in today’s cold email landscape. Test one variable at a time, refine your strategy continuously, and focus on the metrics that directly impact revenue. This consistent, data-driven approach ensures your emails deliver measurable results.
FAQs
Which email metric matters most for cold outreach?
When it comes to cold outreach, the reply rate stands out as the most telling metric. Why? Because it measures actual engagement from real people - not just passive actions like opening an email or clicking a link.
Focusing on reply rates shifts your attention to what truly matters: meaningful conversations and actionable responses. Unlike surface-level metrics, replies indicate that your message resonated enough for someone to take the time to respond. That’s the ultimate goal of any outreach campaign.
How can I tell if my open rate is inflated by bots or privacy tools?
Open rates can be misleading due to Apple's Mail Privacy Protection, which preloads emails and registers them as opened, even if the user hasn’t interacted with them. This impacts over 55-60% of mobile email opens. On top of that, security gateways and email tools can create false clicks and opens, further skewing engagement data. To get a clearer picture of performance, prioritize metrics like click-through rates or replies instead of depending entirely on open rates.
What bounce rate is too high, and what should I fix first?
A bounce rate higher than 3% is a red flag. To lower it, prioritize improving email deliverability. This involves setting up your domain correctly and using authentication protocols like SPF, DKIM, and DMARC. Strive to maintain bounce rates at or below 1% to achieve better performance.